

Context matters more than numbers…
Considering the art vs science argument of investing…Part 1 was the artsy aspect of buying for the long-term. Part 2 is more science. From a professional standpoint, there is a lot more to a buying a stock than loving a company and its product. Every type of valuation trade has one thing in common though – which Warren Buffett put best – “Price is what you pay, value is what you get.” Stocks are rarely priced in line with their value. If they were, then we wouldn’t see the stock market, or any stock, moving up and down every single day. Daily volatility is a microcosm of the volatility associated with the disconnect between price and value. Other than the fact that speculation exists, there is no justification for a stock to fluctuate weekly or monthly, let alone day to day….IF stocks traded in line with their intrinsic value. IF that was the case though, how the F is everyone going to agree on a single company’s valuation?! A single company…let alone the broader stock market composed of thousands of companies.
Much of this is attributable to the infinite number of fundamental factors influencing valuations. In fact, one of these factors is the product of all of the existing influences intertwining and creating even more volatility. And then this ghost feeds back into itself as investor emotion. If we delve further into this notion of reflexivity though, we’d have to tackle George Soros’s Alchemy of Finance. That would blow up the internet though, so, back to common drivers of stock valuation trades:
Revenue Growth
In my humble opinion…where I’m right 95% of the time (note sarcasm) …this is the most important X-factor for every stock in the world over the long-term. There are many shorter periods where factors other than revenue growth matter more – such as financing for a fledgling company trying to live another day, regulatory rulings for a company under legal pressure, product pricing/margins in an oligopoly, etc. Once these shorter-term concerns make or break a company, the stock’s revenue path will reemerge as its biggest concern. All told, for the factors not directly related to revenue growth, they are all indirectly related. If the company makes it, it will be because revenues don’t go to zero. And if it fails then vice versa. Feel free to bring up arguments against the revenue growth story, though I will crush them like Drago/Creed.
One of the most common reasons to expect higher revenue growth is declining growth in the past. This can be categorized as a reversion to the mean trade. Reverting to the mean is the basis of many many trades/investments. As another recurring theme, I’ll use a couple buddies as guinea pigs – let’s call these two the Nerpa Bros. The Nerpa Bros valued Rent-A-Center (ticker RCII) at double its stock price at the time. To arrive at a target price implying 100% appreciation, they publicized a conservative 0% FCF growth rate and a 15% WACC to match the conservatism. FCF’s main driver is most often, if not always, revenue. So, it’s safe to say that zero % revenue growth is implied. Upon first glance it seemed like a great trade so I was intrigued and asked them some questions to elaborate. Never mind the fact that I’m still waiting for those answers, but I did some research of my own and instantly saw why such a simple analysis looked so promising…and misleading.
The Nerpa valuation report mentioned that RAC’s main competitor, Aaron’s (ticker AAN), had a much higher valuation ratios than RAC (EV/EBITDA and Price/FCF, specifically). To generalize, high revenue growth rates drive higher multiples, so I was confident that Aaron’s growth rate would be higher than RAC’s. I did not think that this would be a product of Aaron’s positive growth rate and RAC’s negative revenue growth rate though. RAC’s recent DECLINING revenues + Aarons’s GROWING revenues = declining RAC market share! Instantly, the Nerpa Bros’ zero % growth rate went from conservative to aggressive. Their valuation lost a main component of its margin of safety (more on this in a future blog). The Nerpa Bros would argue that there is more to their valuation, which should be a given in any respectable valuation trade, but I digress. Given the importance of revenue growth assumptions within stock valuations, the absence of these facts provided me with enough reason to vacate my initial interest/curiosity. I felt that I’d have to analyze the Nerpa valuation from scratch to make sure there were no other holes, so I passed. The Bros’ RAC valuation could still come to fruition as there is much more to consider and of course RAC could return to revenue growth. For me though, the trade was nowhere near as attractive as it previously looked. This example brings up the importance of context within not only revenue growth stories, but basically every scope of stock valuation trading.
Fluctuations in revenue growth are due to many organic (company-driven) and inorganic factors. Those organic factors include new products leading to new revenue streams, product improvements, greater production capabilities, etc. Influences from outside the company include improving economic conditions, industry trends, less competition, regulatory consequences, change in consumer tastes…you get the point. That being said, no matter which way revenues are growing or declining, revenue growth must be taken within CONTEXT. If a company with declining revenues finally stabilizes to flat revenue growth year over year, buying that transition could prove rewarding. Likewise, the stock of a company doubling revenue annually might get walloped if revenue growth unexpectedly declines to 80%. I don’t want to kill the proverbial take revenue growth within context “horse,” so let’s move on.
Before we dive into other drivers of stock valuation too quickly, let’s reiterate the big picture of this multi-pronged blog on Trading Stocks. We’re looking at different types of trades under the premonition that trades start out one way, but end up being misconstrued by changes in the market/stock price. So, in the case of stock valuation trades, if we buy a stock with expectations that the stock will appreciate as its revenue growth rate rises, we have to stick to this thesis and not get caught up in new developments. These developments sway us towards investing with the herds of other emotional investors. The key to avoiding this is to maintain our initial strategy so we can manage trades according to company fundamentals instead of emotions.
While maintaining that revenue growth is the #1 X-factor in stock valuation…let’s also reiterate that this point needs to be taken within greater context of stock valuation. There are many other metrics that which drive the value of stocks, especially within certain trading horizons. For example, if revenue growth is the impetus for a certain trade that isn’t panning out, we have to think twice before allowing expanding margins to take the place of our initial thesis. Are we reaching for any hope of an uptick or has the story changed to the extent that the improving margin trade is one worth pursuing? On that note, let’s start with margins as a driver of stock valuations.
Improving Margins – Profitability
We’ll keep it brief and move quickly now that the behemoth of stock valuation drivers is out of the way. Whether gross, net, or operating margin, they all measure profitability. Improving these dwindle down to either reducing expenses or increasing revenue via pricing. Increasing revenue through volume does not do the same. Gross margins (Gross Profit/Sales) are static without some form of economies of scale. All else equal (ceteris paribus is a recurring theme in an environment which has a gazillion inputs). If you generate more income for every widget you sell, your stock is more valuable. This is not necessarily the case if you don’t generate/maintain the same net income margins.
Improving Turnover – Efficiency, Use of Assets to Generate Sales
All else equal, a lemonade stand that sells more lemonade using less products and materials is more valuable than one which uses more product and materials. This is the definition of Asset Turnover (Sales/Assets). For example, improving the supply chain logistics of the company means your assets are more efficient, or there is greater output from similar/less inputs. Improving efficiency (asset turnover) and profitability (margins) fall under the operations umbrella of a business. These form the wide basis of improving business operations to increase shareholder value. The last point considers improvements in financing of a business to increase shareholder value.
Improving Leverage – Debt vs Equity
Financial leverage measures the level to which a company borrows money to run its business. Leverage (Assets/Equity) is not as straightforward as Profitability or Efficiency, where higher is better. On one end, lower leverage is better as a company that borrows less may be viewed as safer than one which borrows more. On the other end, it can be argued that a company needs to borrow money to a level which promotes the maximum use of tax-advantaged interest payments (the revenue used to pay company’s interest is considered “interest expense,” and therefore goes untaxed). In the latter case, one believes a company should take advantage of debt-financing so it spreads profits over less equity (thus, greater returns for shareholders). Without getting into too much unnecessary detail for our purpose, higher or lower financial leverage ratios possess the potential to add value to stock prices.
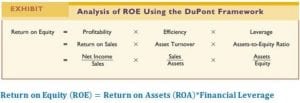
I’m sure many of you have recognized use of the DuPont model over the discussion of Profitability, Efficiency, and now Leverage. The flow of money from a company to a shareholder’s pocket is obvious within the concept of the DuPont framework: raise capital to buy assets –> assets generate sales –> sales generate income –> returns to shareholder. Mind you, in an overtly simplified sense, it makes sense that the model which defines and breaks down returns to shareholders (ROE), gave us the main drivers of stock valuation trades. For a visualization, below is the three-step DuPont Framework. And for those who want even more, here’s a link to a three-step vs five-step DuPont analysis.

Takeaways:
1) Revenue growth is the #1 driver of stock value over the long-term. It must be referenced within context (of the company’s history and of many other drivers of stock value)
2) Breaking down Return on Equity (or return to shareholders) via the DuPont Model shows that Profitability, Efficiency, and Leverage drive shareholder returns.

Great points, here is a related article written by Mauboussin (writes lot of CFA stuff as well):
https://www.morganstanley.com/im/publication/insights/articles/article_themathofvalueandgrowth_us.pdf?1591814348662